

1. Introduction
2. In situ industrial CT scanning
3. Hydro-mechanical laboratory testing coupled with in situ CT imaging
3.1 Hydraulic fracturing experiment
3.2 Fracture permeability test
3.3 Image contrast enhancement by KI solution
4. Summary
1. Introduction
Understanding the hydro-mechanical behavior of rocks is very important for most underground industrial activities, such as the development of conventional and unconventional reservoirs, hydrocarbon storage, and nuclear waste disposal. Hydraulic fracturing has wide field applications for the purpose of permeability enhancement of reservoir rocks with relatively low permeability, such as granite, shale. Prediction of initiation and propagation of rock fracture and fluid flow in rock pores and fractures has attracted significant attention from researchers. In many instances changes can occur inside a rock sample induced by applied stress or fluid injection or a combination of the two while outside appearance of the rock remains unchanged. For example, a hydraulic fracture starts near a borehole, or pre-existing fractures inside a rock become closed due to applied external stresses. X-ray computed tomography (CT), as a typical non-destructive testing method, has been widely used in medical and various engineering fields. CT scans help one to visualize 3D structure, particularly the defects (e.g. pores and fractures) in the object being scanned as well as flow visualization (Heindel, 2011). Moreover, CT data can be directly used for numerical modeling (Watanabe et al., 2011; Kling et al., 2016; Yang et al., 2017).
Industrial X-ray CT scanners are frequently used for laboratory study in the field of geosciences (Ketcham and Carlson, 2001; Cnudde and Boone, 2013). Normally samples are scanned free of restrictions (e.g., stress, displacement) prior to and after the experiment at a steady state, and changes inside the sample are analyzed. The experiment is conducted outside of the CT scanner. This has been reported as ex situ CT in previous studies (Buljac et al., 2018; Leißner et al., 2020). For the purpose of monitoring changes inside a sample subjected to loading or other treatment such as heating, the different parts of the testing equipment should be connected with samples placed inside a scanning chamber. This type of system using X-ray is usually called in situ X-ray CT. Recently, Li et al. (2020) reviewed in situ medical and industrial CT scanning systems, particularly focusing on geomechanical testing. The spatial resolution of industrial in situ CT was reported to be 0.7~300 μm depending on the specifications of CT scanner used, sample size and test conditions.
In this study, we first review state-of-the-art of in situ CT applications for study of geomaterials. Then, we introduced two triaxial cells designed for laboratory experimental investigation of hydro-mechanical behavior of rocks, coupled with in situ CT scanning. A preliminary attempt for in situ CT imaging of granite and sandstone are presented. It should be noted that in situ CT imaging was conducted on rock samples inside triaxial cells while investigation of the hydro-mechanical coupled processes is yet to be implemented.
2. In situ industrial CT scanning
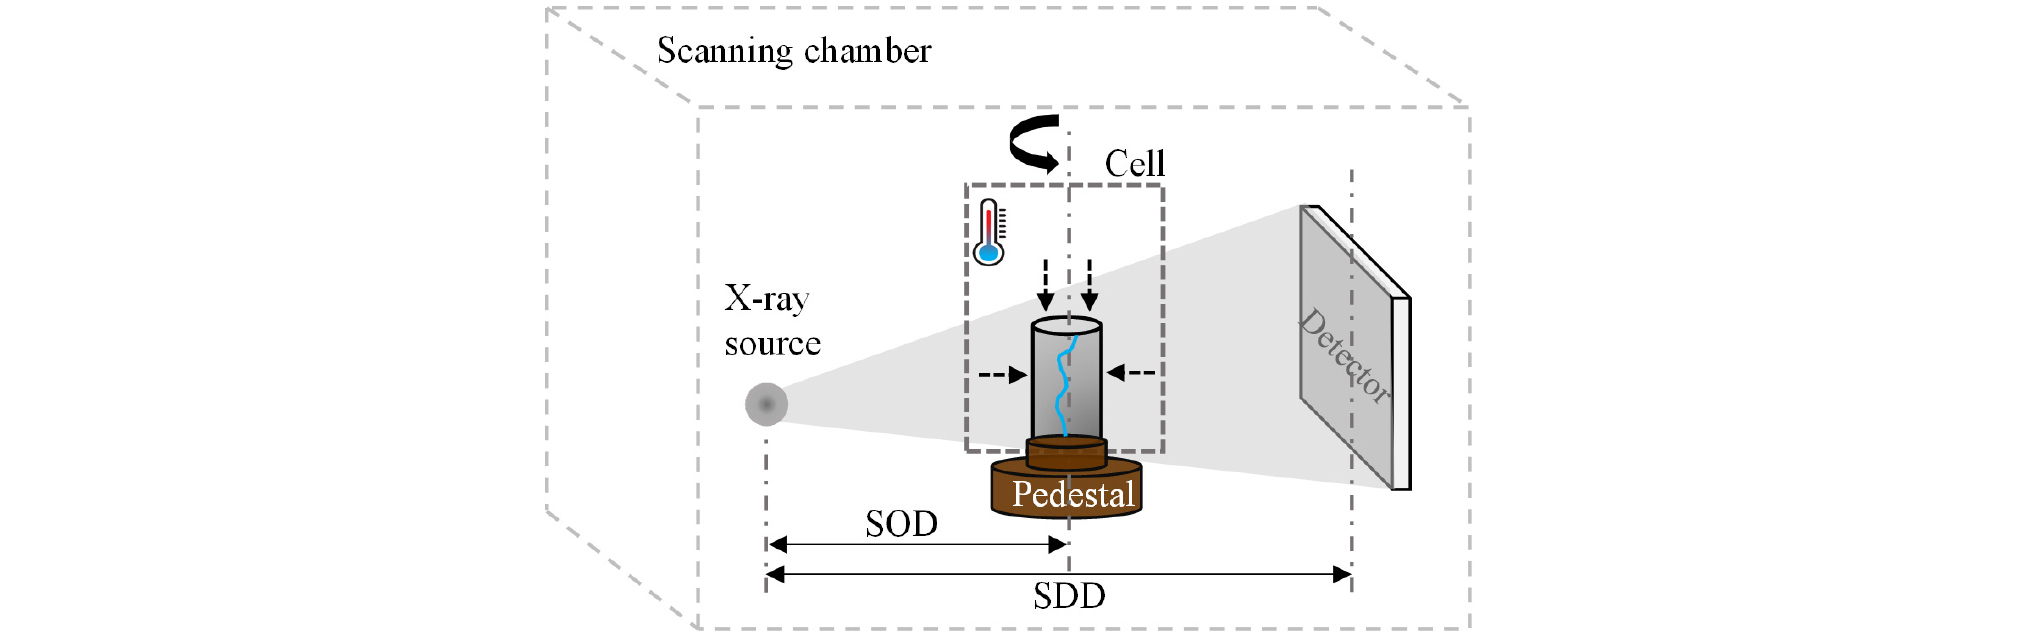
The fundamental principles of X-ray CT have been frequently introduced. For a detailed introduction to industrial X-ray CT, we refer to ASTM (2011) and Hermanek et al. (2018). An in-situ industrial CT scanning is simply described in Fig. 1. The scanned object (e.g., a rock sample) and a cell are installed on the pedestal, and placed together in the X-ray scanning chamber. According to different research purposes, the cell can provide various functions, such as mechanical loading, thermal loading and fluid flow. Other components such as the control panel, pumping system and accessories of the testing system can be placed outside of the chamber. The in situ CT scanning system allows one to obtain the 3D structure of the sample subject to loading, but under a quasi-static condition. Depending on the specifications of the scanning system, typical industrial CT scan takes up to half an hour or more. Therefore, it is almost impossible to catch catastrophic failure or to investigate real-time changes inside a sample. For in situ CT scanning design for the cell, one should consider the source to object distance (SOD) as well as the source to detector distance (SDD). As the name implies, the SOD is the distance from the focal spot of an X-ray tube and the center mass of the object, and the SDD is the distance from the focal spot to the detector, as shown in Fig. 1. Geometry magnification is determined by the SDD and SOD ratio. For a specific X-ray CT scanning system (e.g., the one used in this study), a decrease in the SOD realized by positioning the object close to the X-ray source allows for an increase in the geometry magnification, and, therefore, an increase in resolution. However, the SOD will be limited by the horizontal size of the cell. Moreover, as significant X-ray energy attenuation occurs upon the cell penetration, it is important to reduce the cell size and select a material with a relatively low atomic number and low density for obtaining high resolution CT scanning, under the precondition that the cell should have enough strength to ensure safety under a given confining pressure (e.g., 20 MPa), particularly for rock testing.
In situ CT for mechanical loading tests has been frequently reported for various rocks and rock-like materials, such as shale (Li et al., 2017; Yang et al., 2018; Li et al., 2020), granite (Li et al., 2020), coal (Ju et al., 2018) and concrete (Yang et al., 2017). Moreover, applications of in situ CT for measuring the deformation of soils have been reported previously (Viggiani et al., 2004; Watanabe et al., 2012). Li et al. (2017) and Yang et al. (2018) employed micro CT (μCT) to investigate progressive failure of shale samples with a diameter of only 4 mm and 5 mm, under a uniaxial compression condition. CT images acquired for ~40 mins were reported to have a spatial resolution of approximately 11 μm/pixel for the shale specimen with a diameter of 5 mm. Ju et al. (2018) investigated mechanical fracturing of coal samples with diameter of 25 mm under confining pressures of 5-15 MPa. Loading was frequently stopped to allow 3D CT reconstruction of the sample and the compressive load was maintained using the servo control function. Fig. 2 shows the evolution of fractures during the loading process. The pre-existing fractures inside the coal specimen close due to increasing load at the beginning of loading, therefore, fractures could not be extracted at the stages A and B. After the peak strength, a spatial fracture network was formed. In the above mentioned two studies using the in situ industrial CT, progressive damages inside the rock specimens are investigated. Dynamic propagation of fractures was impossible to be captured because acquisition time (3D reconstruction from CT scan) usually lasts for up to one hour or more, depending on sample size and scan conditions. The acquisition time will influence image quality and it can be optimized through selection of the exposure time for each projection, projection number as well as reconstruction algorithm (Lin et al., 2018). However, the improved acquisition time is still at a minute scale while dynamic fracture propagation is thought in the range of microseconds or even less.

Fig. 2.
3D reconstruction of CT showing the progressive damage in the coal specimen subjected to axial compressive load under 15 MPa confining pressure. The green color represents fracture networks, and line drawings represent fractures in a cross section (after Ju et al., 2018)
There are limited cases of in situ CT study for the hydro-mechanical coupled behavior of rocks. A synchrotron X-ray μCT study has previously investigated hydraulic fracture propagation in a limestone sample with a diameter of only 9 mm diameter, and pointed out that fractures propagate by connecting existing cavities (pores) and grain boundaries (Renard et al., 2009). However, the sample size is too small to be applied for some rocks with grain sizes on the millimeter scale. A recently developed relatively large scale in situ CT equipment, named “GEOACT”, compared to the above mentioned μCT, has been reported (Li et al., 2020). The GEOACT can provide a maximum axial force of 2000 kN, maximum confining pressure of 50 MPa, and a maximum value of 50 MPa for both the seepage pressure and gas pressure. It works under a temperature range of -40 to 200°C, and is capable of in situ CT imaging while carrying out mechanical and hydro-mechanical tests on samples with diameters ranging 50-100 mm.
Another example using the GEOACT shows a shale sample (diameter of 50 mm) fractured by supercritical CO2 under a confining pressure of 30 MPa. In situ CT imaging reveals 3D fracture networks and a distribution of fracture apertures less than 1 mm in size. This resolution enables laboratory investigations of hydraulic fractures for most rocks. Fracture initiation and propagation were not observed as the shale sample was fractured by continuous injection within hundreds of seconds. CT observation of hydraulic fracture propagation in a granite sample (diameter of 30 mm) subject to cyclic injection was reported, with fractures found to grow with increasing number of cycles (Zhuang et al., 2018a; 2020a). However, for each scan, fluid injection was stopped and the granite sample was removed from the hydraulic fracturing test equipment to allow for scanning in the stress-free state.
It is questionable whether a hydraulic fracturing process for rocks can be investigated even using an in situ CT, as the fracture initiation and propagation process under a given fluid pressure is expected to be completed in an extremely short period of time compared to the scanning time (e.g. 30 mins). Another challenge is how to obtain high resolution images by CT scanning, which decides whether or not the observational method is applicable for capturing changes inside a given sample. CT image quality such as noise, artifacts and spatial resolution is influenced by many factors, in which the specifications of test equipment, sample properties as well as reconstruction algorithms have the greatest impact (Shefer et al., 2013; Shan and Lai, 2019). For a given CT system, the selection of appropriate scanning parameters such as voltage, current, scan time, are very important for obtaining high quality CT images.
In spite of a very few cases and limitations of in situ CT for investigating coupled thermo-hydro-mechanical-chemical (THMC) behavior of rocks, application of in situ CT or μCT together with geotechnical testing for the investigation of coupled THMC processes in gas hydrate-bearing sediments has been reported (Deusner et al., 2017; Lei et al., 2018). The developed in situ CT reported by Deusner et al. (2017) can deal with sample diameters ranging from 50-150 mm and a maximum confining pressure of 40 MPa.
3. Hydro-mechanical laboratory testing coupled with in situ CT imaging
Industrial X-ray cone-beam CT is used and the equipment contains three X-ray tubes operating at low to high voltages of 120 kV, 225 kV and 320 kV, corresponding to a focal spot size of 400 μm, 6 μm and 0.4 μm, respectively. A flat panel detector is used that has an active area of 40 cm × 40 cm and a pixel matrix of 2048 × 2048. The designed load capacity for the work table is 100 kg. For the in situ CT scanning carried out in this study, we applied an exposure time of 1 second per projection for a total of 1200 projections. As a result, the minimum scanning time was 20 minutes excluding other time costs such as overhead time.
3.1 Hydraulic fracturing experiment
Hydraulic fracturing is a well-stimulation technique widely used in reservoir engineering development. It is applied to conventional oil and gas extraction, shale gas and enhanced geothermal system, and has become a major research and engineering topic in a large variety of geological conditions. Investigation of the fracture initiation and propagation process can help one to understand the fracturing mechanism. In laboratory experimental study, acoustic emission (AE) monitoring has been frequently applied in previous studies and the process of hydraulic fracturing can be analyzed based on the evolution of AE data as well as injection pressure (Zhuang et al., 2019; 2020a). However, AE monitoring has limitations for fracture observation during laboratory-based experimental study for small rock samples (e.g., 50 mm in size), because of location errors for AE events particularly in the case when AE sensors are not able to be installed directly onto the rock sample.
For the purpose of directly observing hydraulic fractures during fluid injection, triaxial test equipment was placed into the scanning chamber allowing CT scanning for the sample inside the triaxial cell. A hydraulic injection pump was arranged outside as it is relatively bulky. Fig. 3(a) shows a picture of the equipment being installed inside the X-ray chamber. The triaxial cell was made of stainless steel. For details about the equipment, we refer to Zhuang et al. (2019). Fig. 3(b) shows an alternative triaxial cell made from engineering plastic (EP). A rotation table was installed at the bottom of the pedestal to allow for rotation of the triaxial testing equipment together with the rock sample. All cables for loading and injection purposes were tied up in a bundle to make sure they did not get stuck during rotation with a maximum of rotation angle of 720 degrees.
Figure 3(c) shows a CT image of a 50 mm diameter. Pocheon granite sample containing three preexisting fractures scanned inside the steel triaxial cell, using a voltage of 250 kVp, current of 2 mA and SOD of 448.9 mm. The image has a pixel pitch of 152 μm. Relatively large aperture (0.5 mm~) fractures can be distinguished; however, mineral recognition is impossible. For the same Pocheon granite, ex situ CT scanning with a resolution of 57 μm/pixel has been reported for a 50 mm diameter sample with hydraulic fracture aperture ranging across ~8 pixels (0.46 mm) under the given test conditions (Zhuang et al., 2019). Metal artifacts due to the high density of steel components can seriously degrade the image quality. Excessive X-ray attenuation due to the high atomic number and high density of stainless steel materials, can prohibit radiation from reaching the detector, resulting in artifacts such as metal artifacts and beam hardening artifacts (Boas and Fleischmann, 2012; Amirkhanov et al., 2011).
The four steel rods were removed and the steel cell was modified to use an EP cell, as shown in Fig. 3(b). The EP material has a much lower density of 1.31 g/cm3 compared to steel. The EP cell has an external and internal diameter of 160 mm and 80 mm, respectively. Therefore the thickness of the cell is 40 mm, and it was tested to be safe under an inner pressure of 30 MPa and vertical pressure of 20 MPa lasting for more than one hour. Fig. 3(d) shows a cross-sectional image of a 50 mm diameter granite sample inside the EP cell scanned under 180 kVp, 0.18 mA and SOD of 260.8 mm. A smaller voltage and current compared to that corresponding to Fig. 3(c) was used because the low density EP cell will attenuate less X-rays than the steel cell shown in Fig. 3(a). The reconstructed 2D image has a resolution of 105 μm per pixel pitch. Fractures (aperture of 0.3-0.5 mm) and minerals, such as mica and quartz clusters can be recognized.
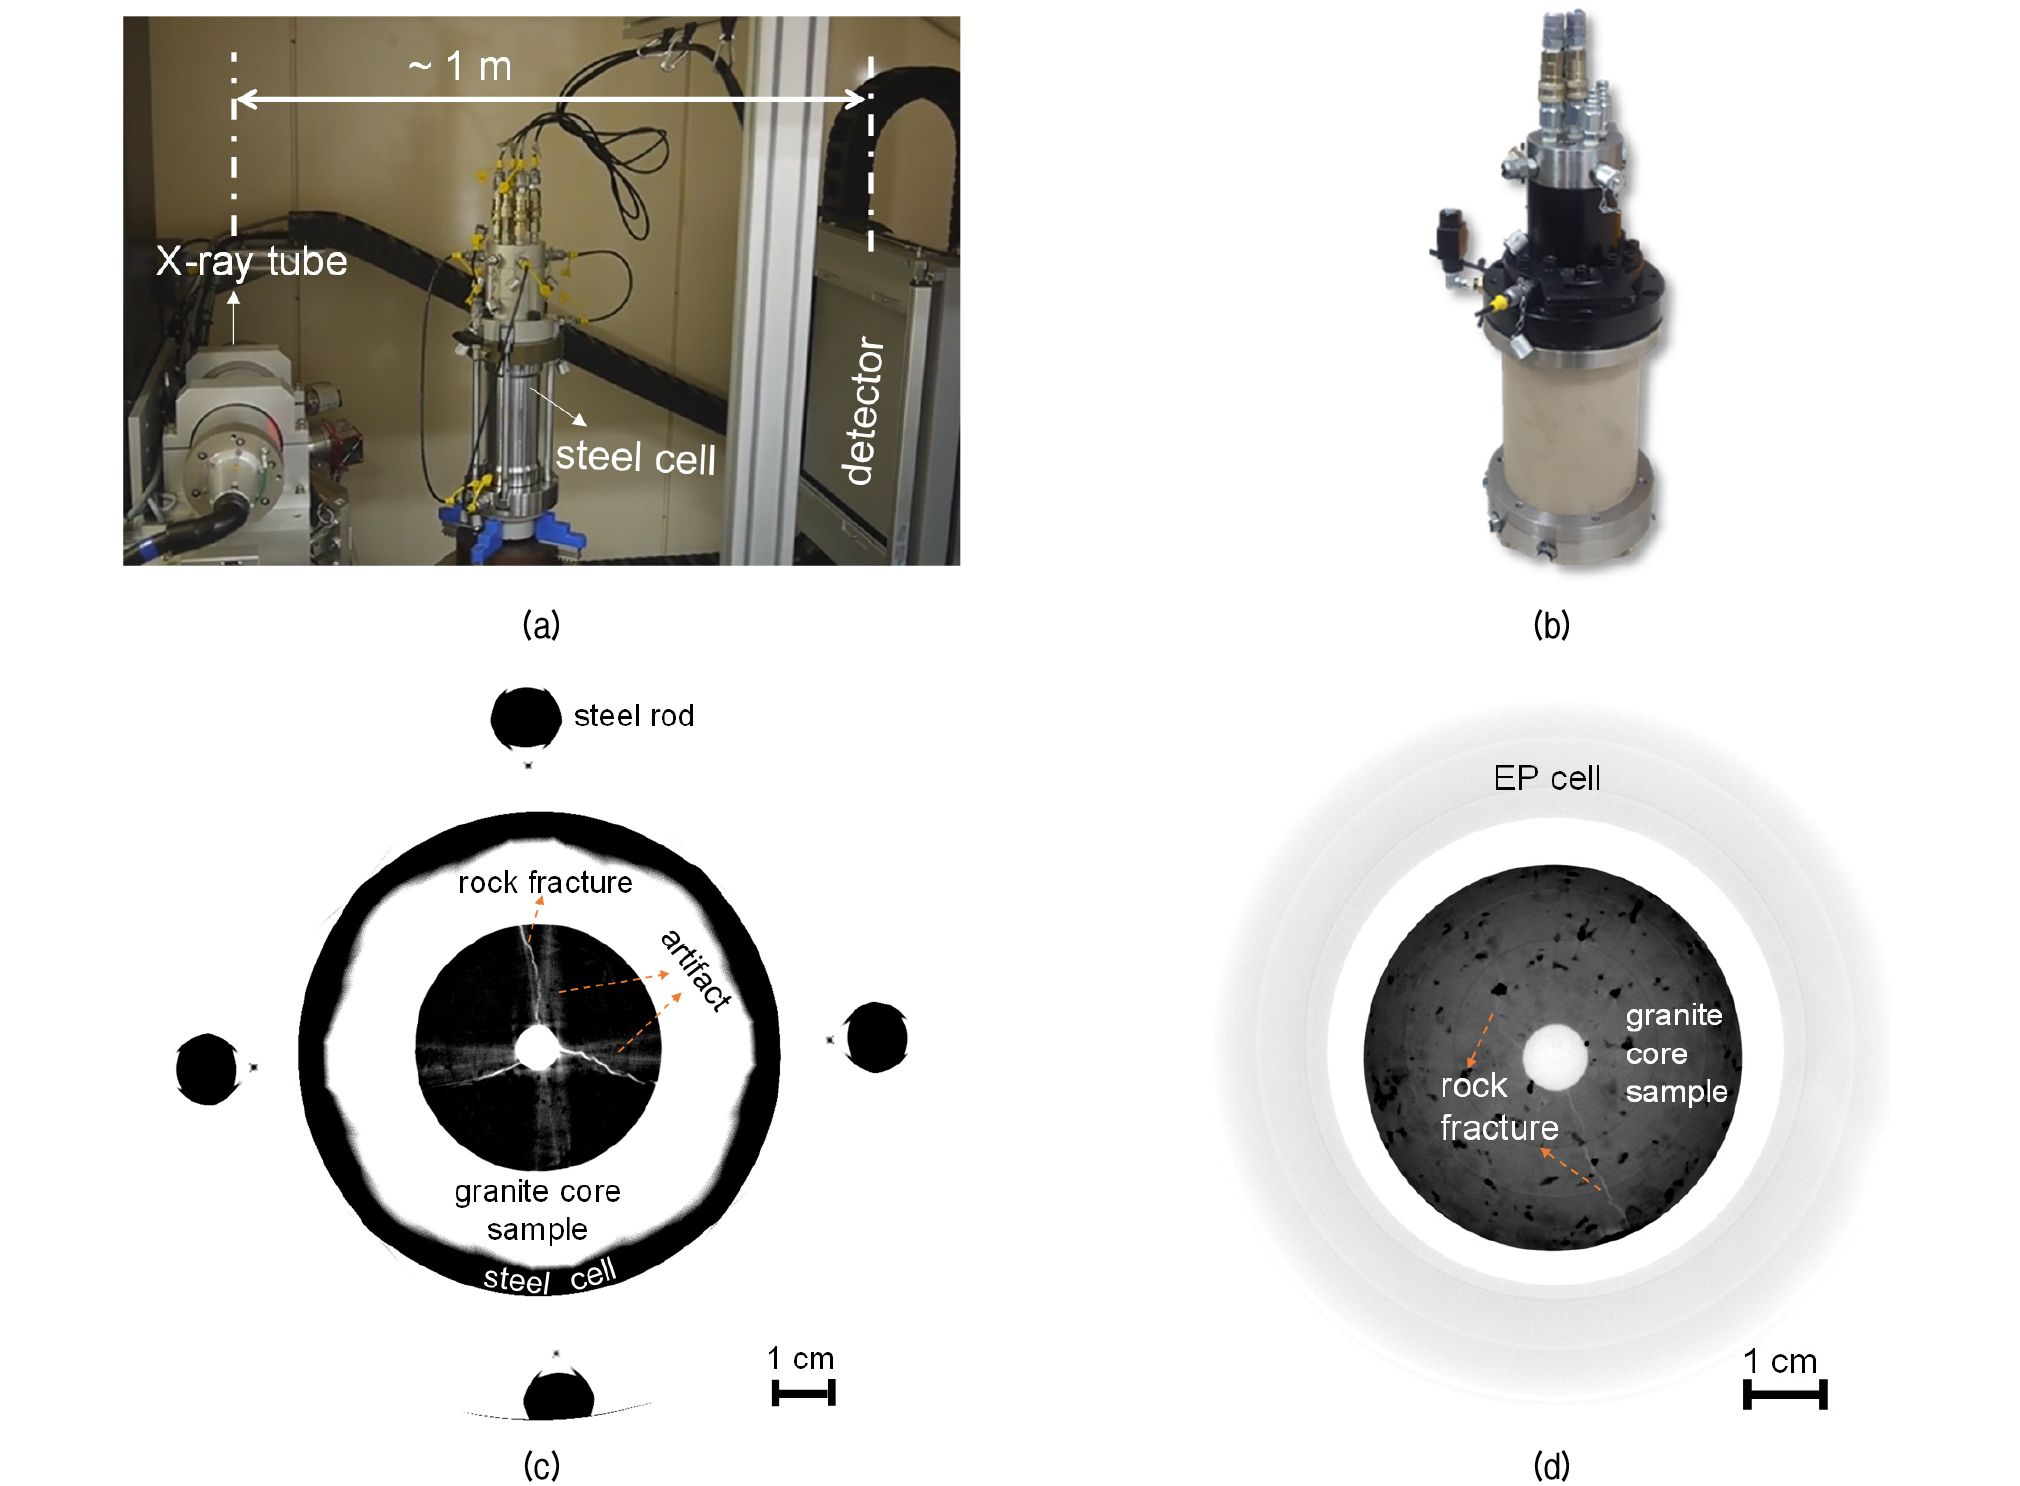
Fig. 3.
Triaxial cell made from (a) steel and (b) engineering plastic designed for a hydraulic fracturing test coupled with in situ CT scanning; (c) and (d) show 2D cross-sectional images of a 50-mm-diameter Pocheon granite sample containing fractures corresponding to the steel and EP triaxial cells in (a) and (b), respectively (Modified from Zhuang et al., 2018a)
An in situ unconfined compression test for a 1-inch (25.4 mm) diameter Berea sandstone sample installed in the EP cell was conducted. The Berea sandstone contains bedding planes and behaves transversely isotropic and its uniaxial compressive strength is reported to be approximately 40 MPa at a porosity of 10-14% (Kim et al., 2016). The axial load was increased in steps of 10 MPa. Fig. 4 shows a 2D CT image of the sample subject to a vertical pressure of 30 MPa and zero confining pressure. The image has a pixel pitch of 73 μm, and beddings in the sandstone can be recognized. Unfortunately, we failed to capture any visible cracks inside the sample before an unexpected catastrophic failure of the sample.

3.2 Fracture permeability test
The cubic law is widely used for estimating the hydraulic properties of rock fractures, assuming that the fracture walls can be represented by two smooth and parallel plates (Zimmerman and Bodvarsson, 1996). Fracture aperture, also known as mechanical aperture, is defined as the vertical distance between the fracture walls. Fracture transmissivity is proportionate to the third-order of the fracture aperture. However, natural rock fractures are typically rough-walled and fracture tortuosity and surface roughness will influence fluid flow in rock fractures. Hydraulic aperture (eh) is more frequently used for evaluating hydraulic performance of rock fractures. Based on the assumption that the fracture walls are simplified as two parallel plates, Fracture permeability (k) can be estimated as:
| $$k=e_h^2/12$$ | (1) |
Previous study has shown that hydraulic aperture is usually smaller than the mechanical aperture, however, discrete fracture network modeling sometimes assumed identical mechanical aperture and hydraulic aperture for simplicity (Zhao, 2017). Fracture aperture usually shows a nonuniform distribution along the fracture length and is significantly influenced by normal stress on the fracture wall. The fluid flow in rock fractures is, therefore, a hydro-mechanical coupled problem. Moreover, previous study has shown that the hydraulic aperture for a single fracture decreases with increasing temperature from 20°C to 150°C (Lima et al., 2019; Peng et al., 2020). This phenomenon involves coupled THM processes, and even more complicated coupled THMC processes in some situations.
For the purpose of evaluating correlation between internal structures and hydraulic performance of rock samples (rock fractures in particular), we installed permeability measurement equipment in the scanning chamber allowing for in situ CT imaging of a sample during fluid injection (Fig. 5). A fluid (water or gas) injection device, discharge part and pressure control panel were arranged outside of the scanning chamber. The triaxial cell was made using carbon fiber and aluminum, which can work under temperature of 150°C and a confining pressure of 20 MPa. A sleeve made from urethane rubber was placed between the sample and cell for sealing. Moreover, the sleeve is detachable and its material can be replaced for specific purpose testing, e.g., high temperature silicon rubber for testing of fractured granite samples under geothermal conditions. The inner and outer diameters for the cell were 38 mm and 92 mm, respectively, allowing a maximum core sample diameter of 38 mm for testing.
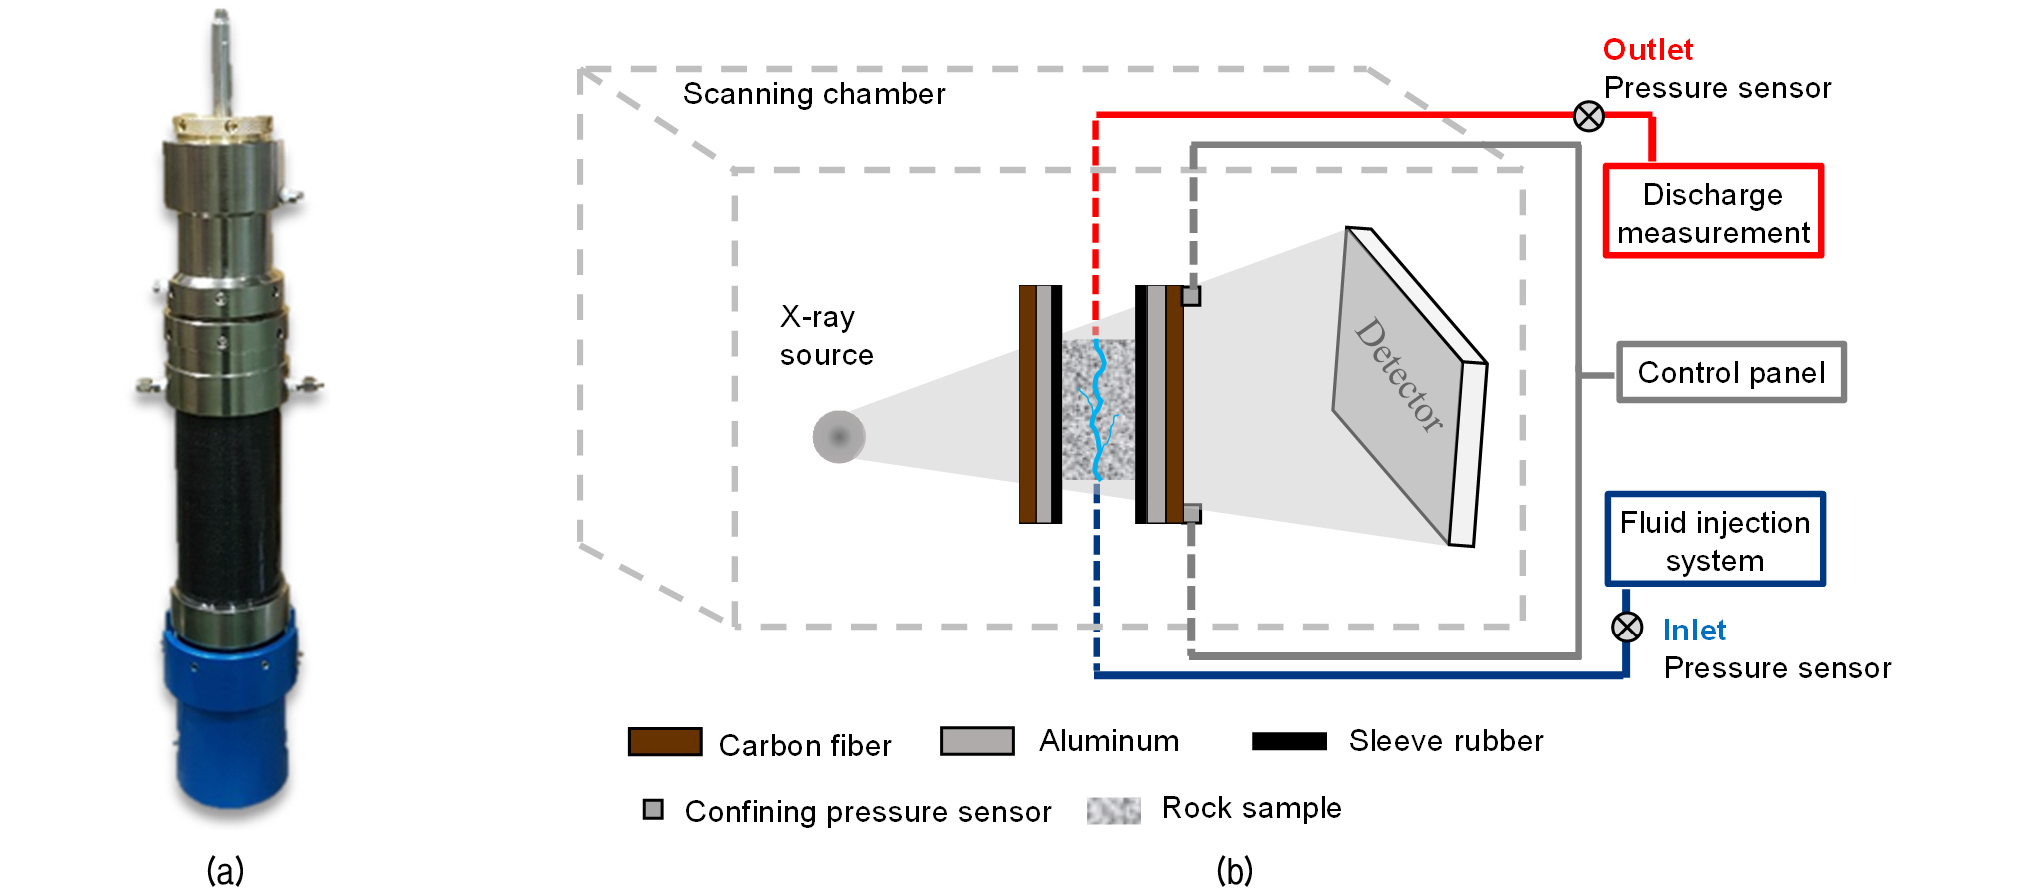
2D cross-sectional CT images obtained at a similar location for the same Pocheon granite core sample (1.25 inch diameter) containing a single hydraulic fracture scanned under ex situ and in situ condition using the triaxial cell are compared in Fig. 6(a) and (b), respectively. The sample was cored from a block sample fractured by water using true triaxial hydraulic fracturing test equipment (Zhuang et al., 2020b). The two images have a pixel pitch of 34 μm and 61 μm, respectively. The aperture of the hydraulic fracture was estimated to be 3-4 pixels (102-136 μm) based on Fig. 6(a). Though the image shown in Fig. 6(b) shows a lower resolution compared to that in Fig. 6(a), the hydraulic fracture and mineral grains, such as mica and quartz, are clearly recognizable. In the near future, we plan to test the permeability of fractured granite samples and aperture changes for different confining pressures of up to 20 MPa. Comparison between the hydraulic aperture estimated from the permeability measurement and mechanical aperture measured from CT images is going to be conducted. In addition, geometric data and estimated fracture aperture based on CT reconstruction can be directly used for 3D modeling of fracture flow in the core sample (Watanabe et al., 2011).
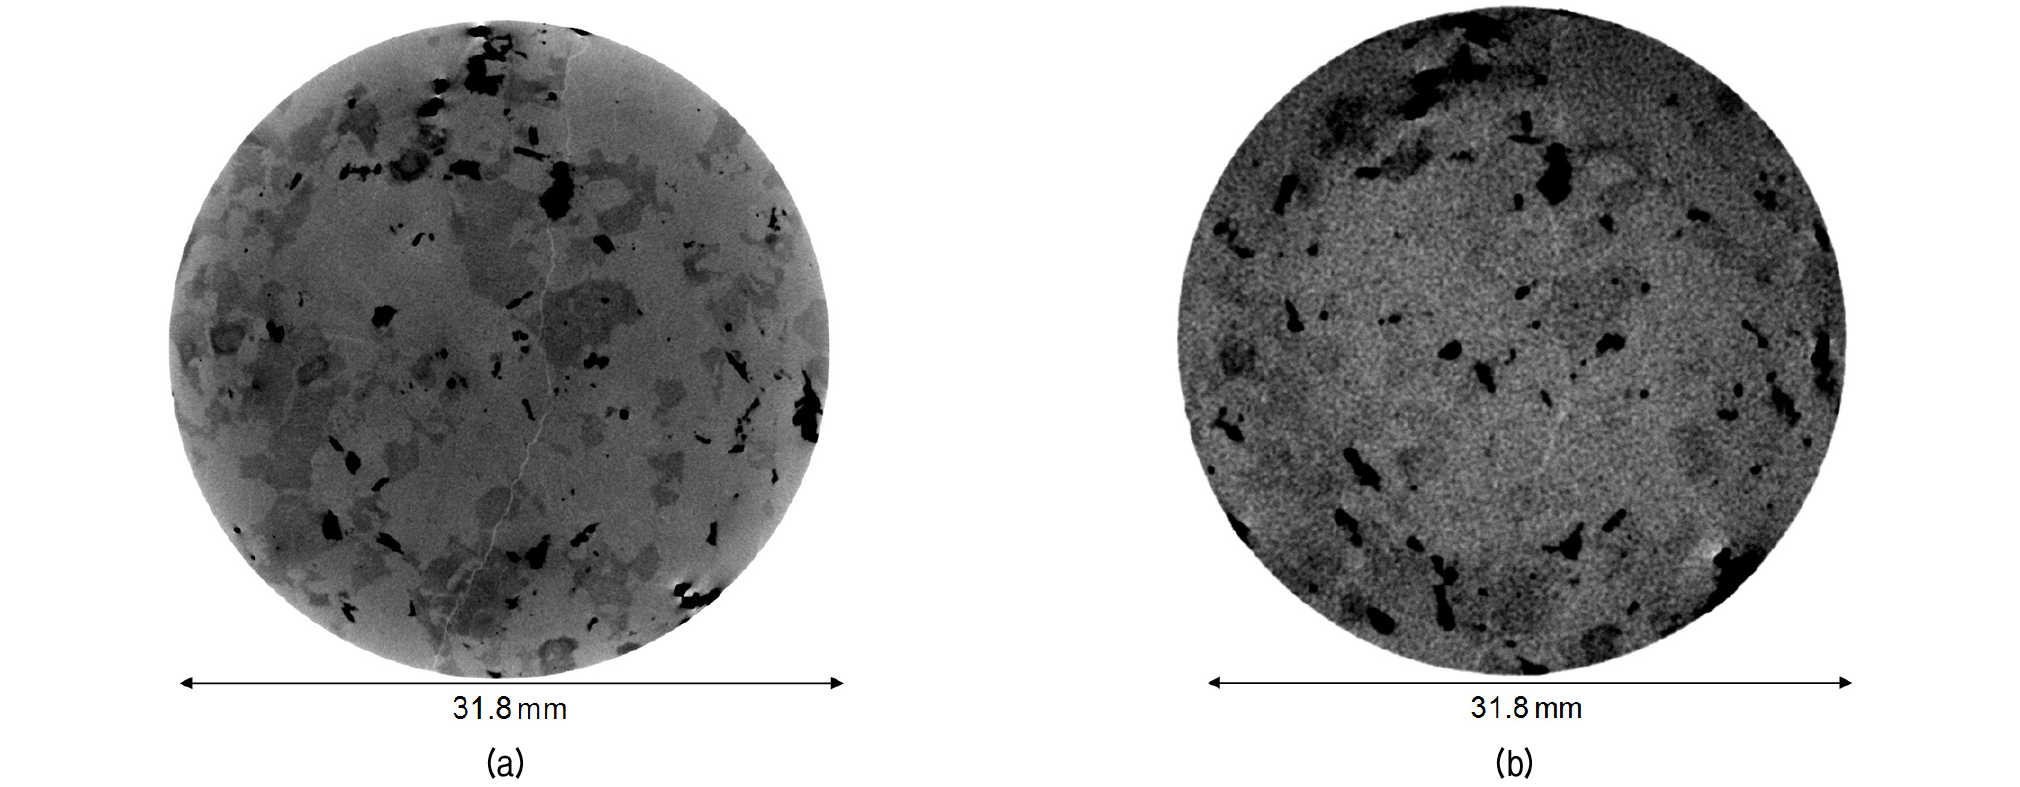
Fig. 6.
Comparison of cross-sectional CT images obtained for a Pocheon granite sample containing a single hydraulic fracture: (a) ex situ scanning with an SOD of 85.1 mm, voltage of 160 kVp and current of 0.16 mA, (b) in situ scanning inside the triaxial cell with an SOD of 152.9 mm, voltage of 160 kVp and current of 0.18 mA
3.3 Image contrast enhancement by KI solution
In some cases, we were not able to obtain CT images with high enough resolution for relatively more accurate analysis, because of the limited spatial resolution of the CT testing system. In this circumstance, additional approaches may help to further improve image quality. Post-processing techniques such as noise reduction, digital image correlation method (Li et al., 2020) and deep learning for crack detection (Hyun et al., 2019) have been reported. For the detection of defects in rock samples, potassium iodide (KI) solution is known to be able to enhance image quality because KI solution shows effective attenuation of X-rays and shows high CT numbers (Ohtani et al., 2000; Lei et al., 2018). Therefore, KI solution can be used as an injection fluid instead of water for the investigation of hydro-mechanical coupled behavior of rocks.
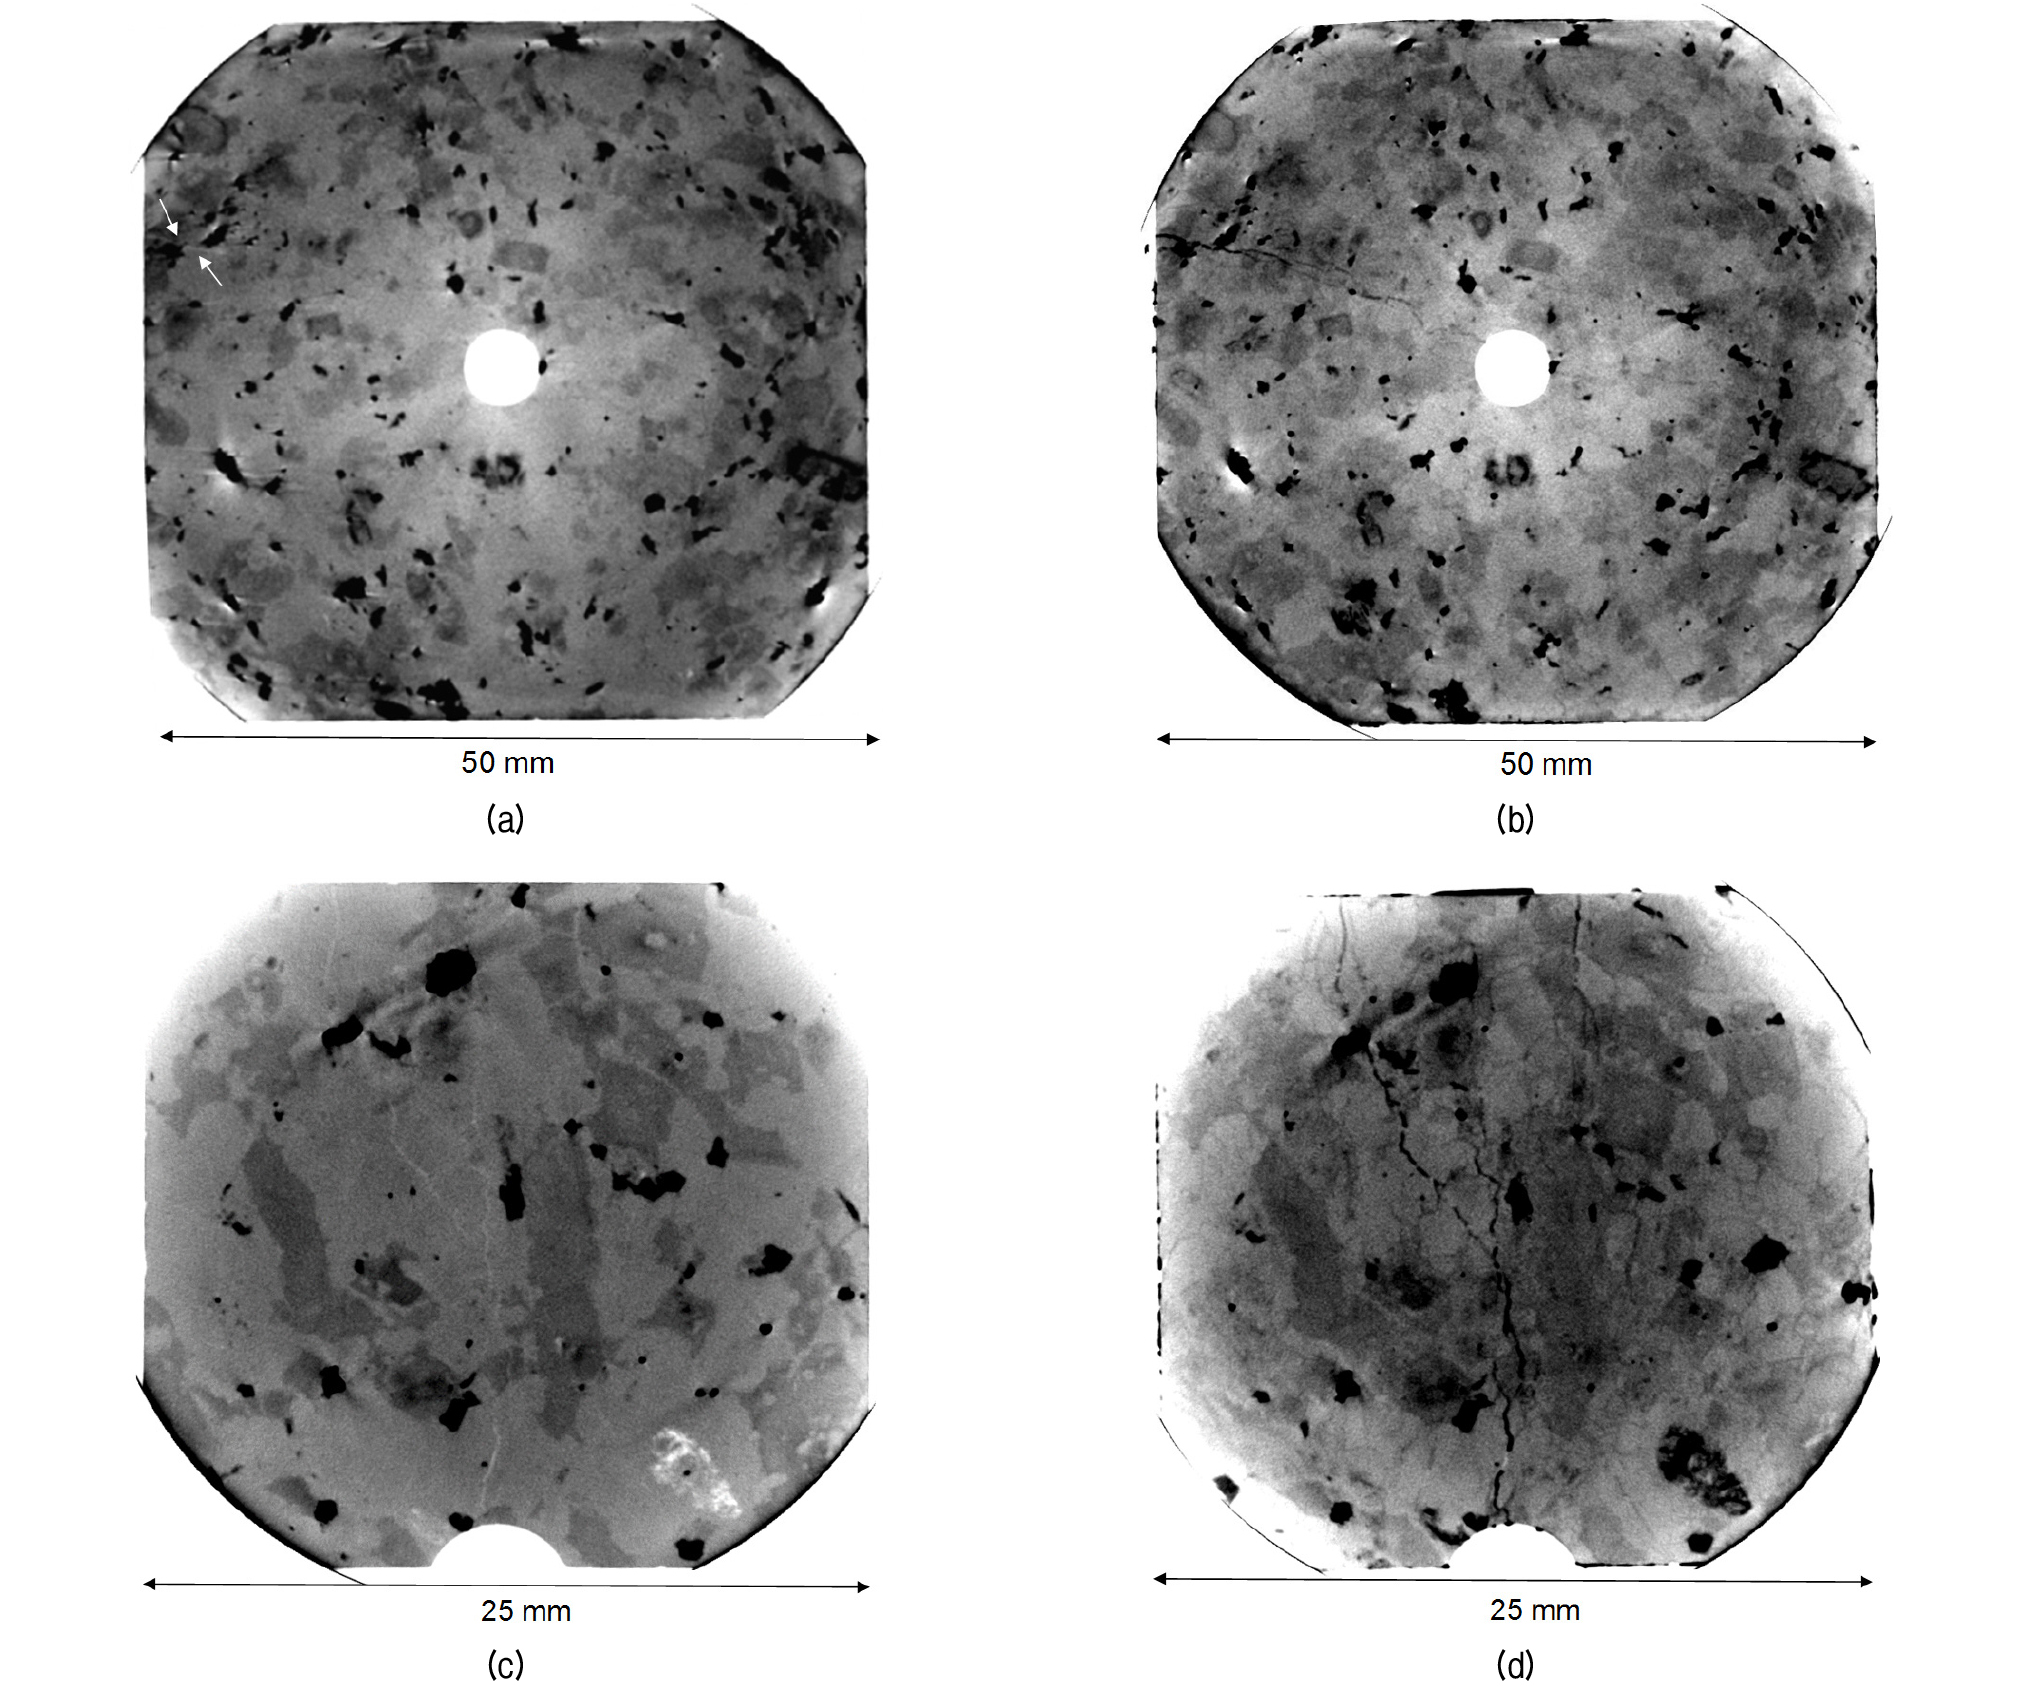
Fig. 7 shows a comparison of CT images obtained for two different sizes of Pocheon granite samples containing hydraulic fractures prior to and after saturation by a 50% concentration KI solution. The granite samples were fractured by tap water under true triaxial stress conditions (Zhuang et al., 2018b). After the hydraulic fracturing test samples were removed from the test equipment for ex situ CT scanning. Then, the samples were immerged in KI solution stored in a vacuum chamber. Hydraulic fractures that were previously hardly recognized in Fig. 7(a) were found to be very clear to the unaided eye after the saturation with KI solution, as shown in Fig. 7(b). Fig. 7(c) shows hydraulic fracture networks (at least three fractures) found to be visible when the sample size was reduced to 25 mm. Image contrasts of the fractures, particularly relatively thin fractures and their surrounding minerals, were found to be further enhanced by KI solution, as shown in Fig. 7(d). Thus, this can help one to quantitatively evaluate fracture properties.
4. Summary
We introduced a recent in situ X-ray CT technique for investigation of the internal structures of geomaterials, particularly focusing on hydro-mechanical laboratory testing of rocks. Two types of triaxial cells made from low density materials such as engineering plastic, carbon fiber and aluminum are developed for hydraulic fracturing and permeability tests of rocks aimed at in situ CT imaging.
Preliminary measurements show that in situ CT imaging can achieve a resolution of 34-105 μm per pixel pitch for granite and sandstone core samples with sample diameters ranging from 25~50 mm installed in the above triaxial cells. This enables observation and quantification of defects in rocks during an in situ testing at the micrometer scale. KI solution shows a good effect of image contrast enhancement, particularly for samples containing fractures, and can be expected to be used as an injection fluid instead of water for future hydro-mechanical laboratory testing of rocks.
Investigation of dynamic fracture initiation and propagation process during fluid injection by using in situ CT remains a challenge. The minimum time period requested to achieve high resolution 3D imaging is quite long compared to the dynamic process involved. Therefore, it is important to design an appropriate loading scheme to capture quasi-static changes for a dynamic fracturing process. For future study, we plan to conduct in situ hydraulic fracturing tests and rock fracture permeability tests for understanding hydro-mechanical coupling processes in rocks.
